
21 July 2025
Market Update Summary - July 21
Major Token Performance Performance
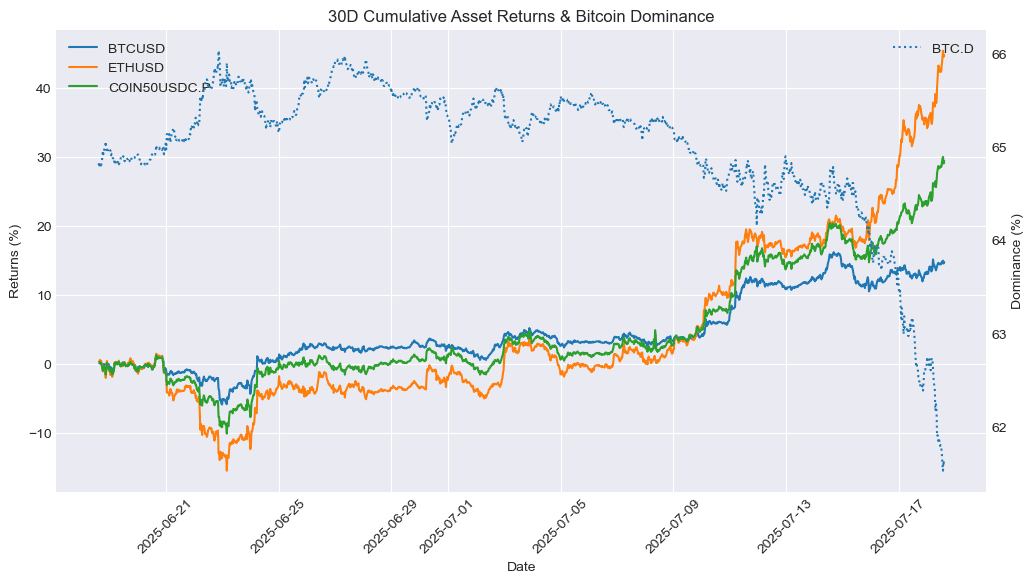
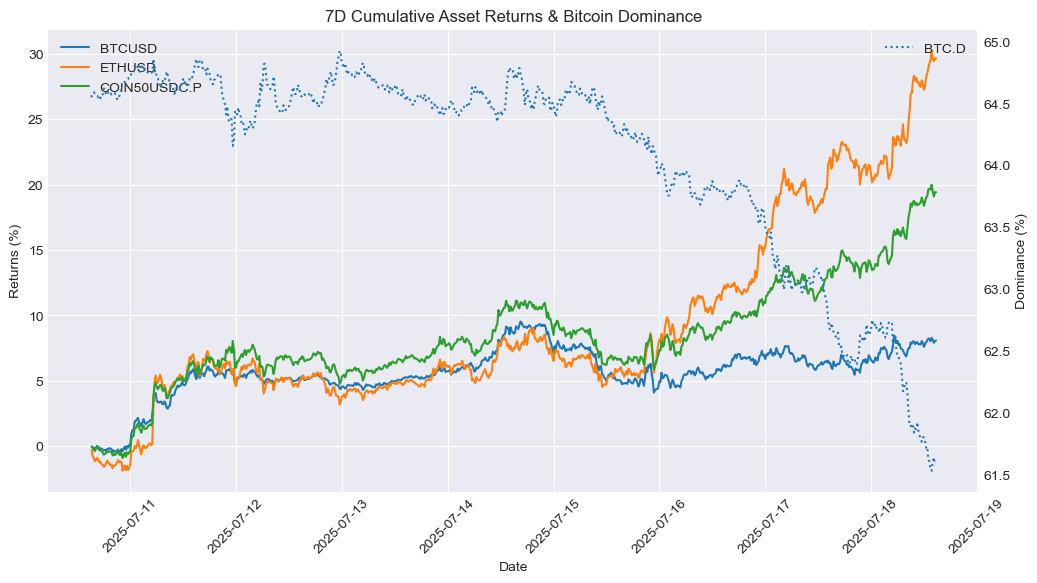
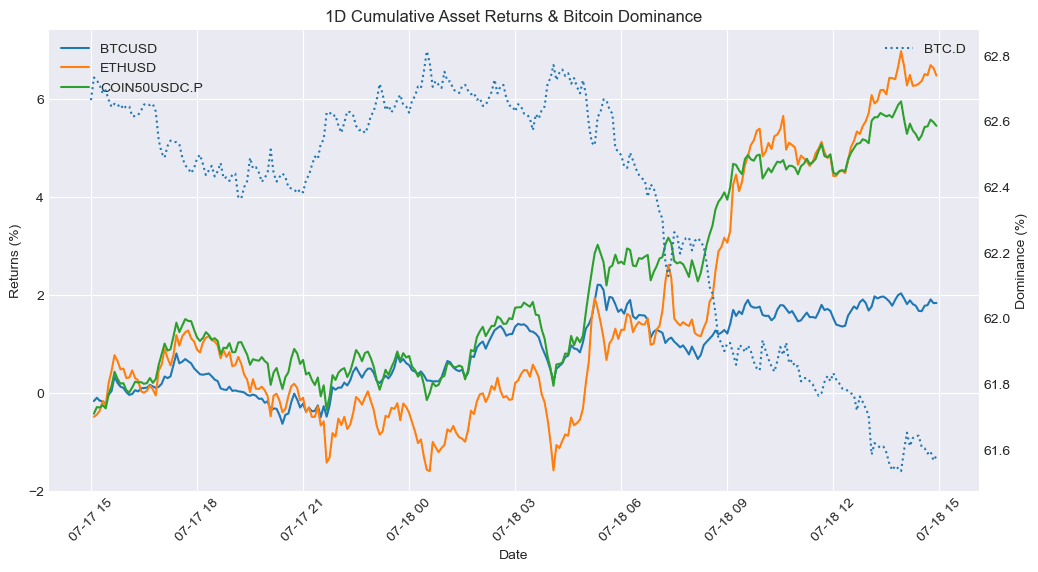
How to Read These Charts
These charts show the cumulative price returns of Bitcoin (BTC), Ethereum ETH), and the COIN50 index over the selected period — 30 days, 7 days or 24 hours. Returns are rebased to 0% at the start of each period to highlight relative performance trends between assets.
The BTC dominance line (secondary axis) tracks Bitcoin’s share of the total crypto market capitalization, offering context on capital rotation between BTC and altcoins. Rising BTC dominance typically indicates capital consolidation into Bitcoin, while a decline suggests increased risk appetite and flows into altcoins.
Use these charts to quickly assess:
- Which assets outperformed or underperformed over the period
- Whether market strength was concentrated (BTC-led) or broad-based
- How shifts in BTC dominance align with overall performance trends
| Asset | 30D Change | 7D Change | 1D Change | Price |
| --- | --- | --- | --- | --- |
| BTCUSD | 14.69% | 8.07% | 1.82% | 120322.91 |
| ETHUSD | 44.69% | 29.65% | 6.48% | 3654.81 |
| XRPUSD | 65.81% | 46.87% | 13.25% | 3.5682 |
| BNBUSD | 14.74% | 11.02% | 3.74% | 746.5 |
| SOLUSD | 24.50% | 15.90% | 5.97% | 183.5 |
| COIN50USDC.P | 29.41% | 19.45% | 5.46% | 515.21 |
| XAUUSD | -1.10% | 0.44% | 0.18% | 3341.42 |
| SPX | 4.99% | 0.59% | 0.49% | 6297.35 |
How to Read This Table
This table summarizes the percentage price change of key crypto and macro assets over three timeframes: 30 days, 7 days, and 24 hours. It includes major cryptocurrencies (e.g., BTC, ETH, XRP, SOL), a benchmark altcoin index (COIN50), and traditional market comparables like gold (XAU) and the S&P 500 (SPX).
The data allows you to:
- Compare short-term and medium-term performance across sectors
- Spot momentum leaders and laggards in both crypto and traditional markets
- Assess whether market moves were broad-based or asset-specific
- Track how crypto assets performed relative to macro benchmarks
This table provides a concise view of market dynamics across different asset classes and helps contextualize crypto performance within a broader macro landscape.
Newly Listed Projects
As of 2025-07-11 10:00PM
Projects and Exchanges
| Project | Symbol | Exchange(s) | Listing Date |
| --- | --- | --- | --- |
| Eclipse | ES | Bybit | 2025-07-16 |
Price Performance
| Symbol | Opening Price | Current Price | 24 hour Change | All-Time High | All-Time Low | Current Multiple from Open | ATH Multiple from Open |
| --- | --- | --- | --- | --- | --- | --- | --- |
| ES | $0.1 | $0.2946 | -13.8% | $0.5335 | $0.1 | 2.946x | 5.335x |
Liquidity Performance
| Symbol | Spread | +2% Depth | -2% Depth | 24 Hour Volume |
| --- | --- | --- | --- | --- |
| ES | 0.07% | $134,022 | $139,140 | $11,676,311 |
Smart Money Flows
Top 10 7D Flows
| Asset | Chain | 30D Flow | 7D Flow | 24H Flow | Market Cap |
| --- | --- | --- | --- | --- | --- |
| PUMP | solana | 3.21M | 3.21M | 4.06M | 1.83B |
| USELESS | solana | -1.85M | 829.23K | -42.83K | 326.79M |
| USEFUL | solana | 720.05K | 720.05K | -5.93K | 1.74M |
| PENGU | solana | 571.36K | 476.82K | 479.12K | 1.95B |
| KIPPAH | solana | 393.60K | 393.60K | 7.34K | 845.25K |
| CPUTER | solana | 257.96K | 257.96K | 257.96K | 13.76M |
| HOSICO | solana | 382.93K | 245.58K | -696.42 | 41.98M |
| DUPE | solana | 102.16K | 110.02K | 2.66K | 13.51M |
| MACROHARD | solana | 107.29K | 107.29K | 6.25K | 364.86K |
| FULLSEND | solana | 102.10K | 102.10K | -10.96K | 2.75M |
Bottom 10 7D Flows
| Asset | Chain | 30D Flow | 7D Flow | 24H Flow | Market Cap |
| --- | --- | --- | --- | --- | --- |
| FARTCOIN | solana | -3.14M | -4.28M | -156.80K | 1.54B |
| GP | solana | -95.61K | -435.41K | -190.36K | 85.71M |
| ANI | solana | -413.70K | -413.70K | -346.41K | 51.52M |
| PYTHIA | solana | -381.02K | -381.02K | - | 69.11M |
| IKUN | solana | -559.63K | -272.60K | -23.59K | 9.44M |
| KORI | solana | -477.12K | -241.08K | -3.09K | 33.14M |
| LAUNCHCOIN | solana | -862.01K | -217.75K | -21.13K | 127.64M |
| GIGA | solana | -18.97K | -175.39K | -198.43K | 218.63M |
| SOL | solana | -19.70M | -174.57K | 2.19M | 84.17B |
| BONK | solana | 60.34K | -169.34K | -3.75K | 2.84B |
These tables track the weekly movement of "smart money" wallets across various tokens and chains.
The Top 10 7D Flows table highlights assets that have seen the largest net inflows from smart money in the past 7 days. A high and rising 7D flow suggests growing interest, accumulation, or conviction by sophisticated traders, and may indicate strong underlying narratives or catalysts. Compare these flows with the token’s market cap to assess relative impact, inflows into small-cap assets are generally more price-sensitive.
Conversely, the Bottom 10 7D Flows table shows tokens with the largest net outflows from smart money wallets. Persistent or large outflows may reflect profit-taking, loss-cutting, or reduced confidence, and can signal weakening sentiment or fading momentum. Watch for sustained outflows alongside declining price or on-chain activity.
Use these tables to:
- Identify tokens where smart money is actively positioning
- Spot emerging narratives or sentiment reversals
- Gauge chain-specific flows, e.g., Solana vs. Ethereum vs. Base
- Inform rotational strategies across high-alpha tokens
Stablecoin Flows
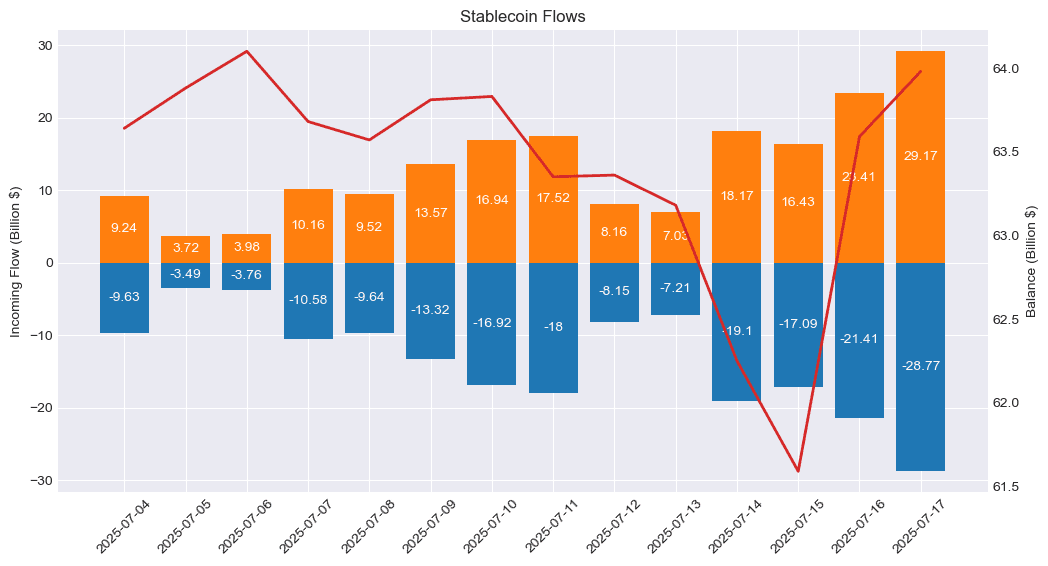
Stablecoin flow data provides a real-time pulse of capital movement across exchanges and chains.
Rising stablecoin balances on-chain or on exchanges often indicate inbound liquidity, capital sitting on the sidelines potentially awaiting deployment into crypto assets. Large inflows may precede buying activity, suggesting growing market participation or renewed confidence.
On the other hand, net outflows of stablecoins could imply that capital is either exiting the crypto ecosystem or being actively deployed into volatile tokens, especially when accompanied by declining exchange balances or stablecoin dominance.
Use stablecoin flows to:
- Detect early signs of market risk appetite
- Monitor capital rotation between stablecoins and volatile assets
- Confirm the sustainability of rallies (is money really coming in?)
- Support broader macro or positioning views from other data (e.g., smart money behavior or BTC dominance)
Macro & Crypto News
July 18: GENIUS Act Passes House, Poised to Become First Major U.S. Crypto Law
The U.S. House of Representatives has passed the GENIUS Act, a stablecoin regulation bill, by a 308-122 vote, marking a historic step toward the country’s first major crypto law. The bill comes alongside the House’s recent passage of the broader Clarity Act for crypto market oversight, signaling growing bipartisan momentum for clear digital asset regulation. The GENIUS Act will set formal rules for stablecoin issuers like Circle and Tether, with Wall Street and regulators closely watching its impact.
July 18: Ethereum ETFs See Record $726M Inflows as ETH Surges Past $3,400
U.S. spot Ethereum ETFs recorded a historic $726 million in daily inflows as ETH soared past $3,400, highlighting strong institutional interest. BlackRock’s ETHA led with $499 million, pushing total ETF holdings to over 5 million ETH—more than 4% of supply. Whale accumulation and rising corporate treasury allocations, including SharpLink’s $1B ETH reserve, suggest growing long-term confidence. Analysts anticipate continued momentum as Ethereum eyes new highs and gains ground amid waning Bitcoin dominance.
July 17: ME Explores 24/7 Crypto Trading, Rules Out Memecoin Derivatives
CME Group is considering expanding to 24/7 crypto trading to better align with global markets but has no plans to offer memecoin derivatives, citing a lack of real-world utility. Instead, the exchange is focusing on institutional-grade assets like Bitcoin, Ethereum, Solana, and XRP, which have driven billions in futures volume. While other exchanges and asset managers eye memecoins for spot products, CME remains committed to tokens with underlying use cases.
July 16: China Merchants Bank’s Brokerage Arm Secures Hong Kong Crypto License
China Merchants Bank International (CMBI) has become the first Mainland Chinese broker to receive a virtual assets license from Hong Kong’s Securities and Futures Commission. The license permits CMBI to offer crypto trading, custody, and advisory services within Hong Kong, but does not extend to mainland China, where crypto remains banned. The move reflects Hong Kong's ongoing push to position itself as a regulated crypto hub while maintaining legal separation from China's strict crypto policies.
July 11: Spot Bitcoin ETFs See $1B Inflows as IBIT Becomes Fastest Fund to Reach $80B AUM
Spot bitcoin ETFs saw over $1 billion in inflows Thursday as BTC hit a new all-time high above $118,000. BlackRock’s iShares Bitcoin Trust (IBIT) became the fastest ETF ever to reach $80 billion in assets, achieving the milestone in just 374 days. This surge reflects growing demand for bitcoin exposure via traditional investment channels, as spot ETFs offer easier access for both institutional and retail investors.
THE CONTENT ON THIS WEBSITE IS NOT FINANCIAL ADVICE
The information provided on this website is for information purposes only and does not constitute investment advice with respect to any assets, including but not being limited to, commodities and digital assets. This website and its contents are not directed to, or intended, in any way, for distribution to or use by, any person or entity resident in any country or jurisdiction where such distribution, publication, availability or use would be contrary to local laws or regulations. Certain legal restrictions or considerations may apply to you, and you are advised to consult with your legal, tax and other professional advisors prior to contracting with us.